
New Study Examines Rejected Ballots in Arizona

[Image courtesy of AZCIR via azcapitoltimes]
Last month, I blogged about an opinion piece from Arizona calling for better and more widely available election data, noting that
the ways that counties handle their election data affects the ability of journalists, researchers, lawmakers — or anyone else for that matter — to efficiently monitor our state’s election process.
About a month later, one of the co-authors of that opinion piece – Brandon Quester of the Arizona Center for Investigative Reporting – has come out with a new analysis of rejected Arizona ballots that not only illuminates the wide variety of causes for such rejection but also illustrates the power of election data.
Here’s the summary finding of the report:
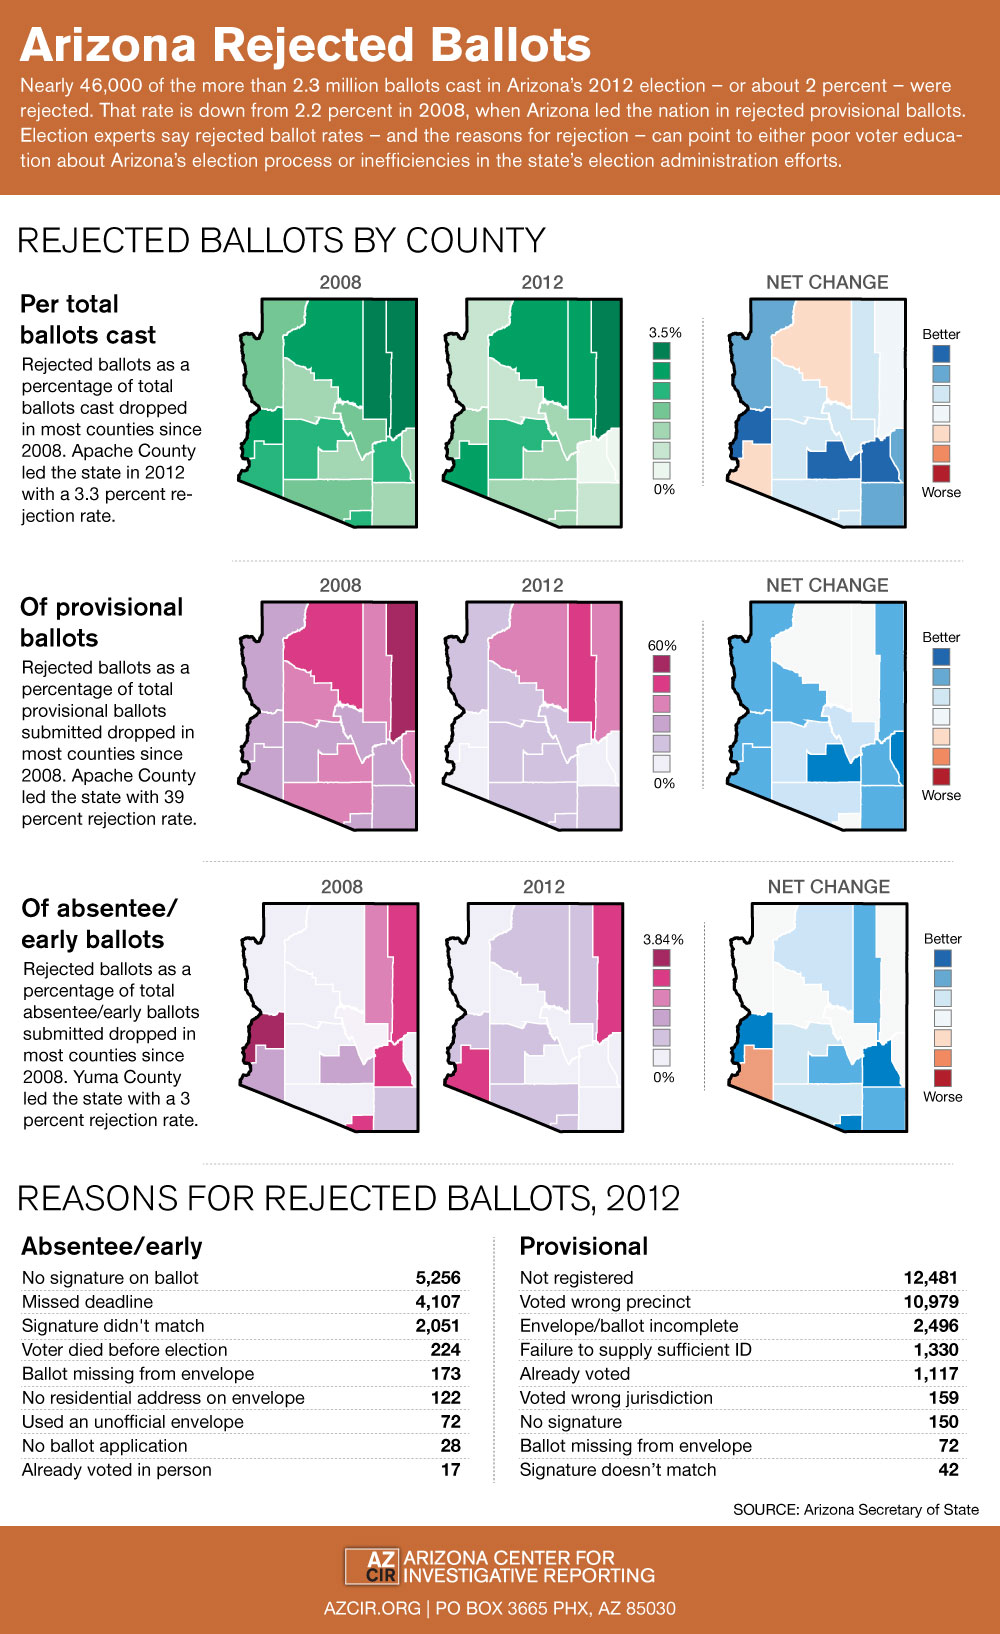
Nearly 46,000 of the more than 2.3 million ballots cast in Arizona’s 2012 election – or about 2 percent – were rejected. That rate is down from 2.2 percent in 2008, when Arizona led the nation in rejected provisional ballots …
The rejected votes consist of early voting or provisional ballots in which voters went through the voting process but later had their ballots thrown out after review by elections officials. The most common reasons were that voters weren’t registered in time for the election, voted in the wrong precincts or didn’t sign their ballots.
Early votes and absentee ballots are cast when a voter is on the permanent early voting list or lives outside the state or country during election cycles. Provisional ballots are cast when voters are not listed on a jurisdiction’s voter roll or registration records, or if they received an early ballot.
Election experts say rejected ballot rates – and the reasons for rejection – can point to either poor voter education about Arizona’s election process or inefficiencies in the state’s election administration efforts.
Quester’s analysis is particularly strong in that it identifies a number of possible causes for rejected ballots while also putting the data into perspective by comparing the figures to 2008. The graphic above (taken from a larger graphic here) shows rejection rates for all ballots, in addition to provisional and early/absentee ballots. Thanks to good reporting by election officials, the report also includes reasons for ballot rejection, which in turn allows for some initial diagnosis about what didn’t work and what needs attention by policymakers and/or election officials.
Some potential topics for reform being discussed include clarifying the process for joining the state’s permanent early voting list and altering the state’s registration rules to reduce confusion:
Of the 33,000 provisional ballots that were rejected in 2012, 38 percent were because the voter wasn’t registered in the state and 33 percent because the voter submitted a ballot in the wrong precinct.
Election officials said voters who weren’t registered might have missed the state’s registration cut-off date, which was 29 days before Election Day. Voters who register after that date are not eligible to vote in that election.
“If someone thinks that they’re registered and isn’t, then that could be an element of voter education that we need to improve,” Roberts said.
Arizona Sen. Steve Gallardo, D-Phoenix, agrees that voter education is an issue but thinks the 29-day cutoff for registration should be changed.
“Let’s get rid of that deadline and have same-day registration,” Gallardo said. “It’s ridiculous that such a large number of ballots are being rejected, and then a large number of people are having their rights taken away because they did not meet a 29-day cutoff day.”
One interesting note in the AZCIR study is that overall, the state rejected ballots at a lower rate in 2012 than it did in 2008, with just a few counties experiencing higher rates last year. [You can do your own analysis using the data available here.]
One more item: tucked away in a methodology link is the following discussion of how the data could be even better next time:
AZCIR spent nearly two months trying to collect precinct-level rejected ballot data, which would have allowed us to do a fair comparison with demographic information from the 2010 Census.
AZCIR sent public records requests to almost half of Arizona’s 15 counties but did not receive precinct-level rejected ballot data. Some counties collect the data to monitor elections and provided the information without an official records request. Others don’t or can’t collect precinct-level data for rejected ballots.
Because counties aren’t required to gather that information and the technology used to gather it won’t allow elections officials to run a report detailing said data, according to county recorders, most counties could not fulfill the public records request.
Regardless, however, the data in the study – and the examination of the state’s election process that it makes possible – is absolutely cutting-edge for the field. Kudos to Brandon and AZCIR for their report, and to Arizona election officials for their assistance in producing the underlying data to make this analysis possible.