
Charles Stewart: "This just in: lines at the polls shorter in 2016 than in 2012"

[Image via electionupdates]
One regular event that I’ve come not just to expect but anticipate is the release of post-election survey data from MIT’s Charles Stewart on voters’ experiences on and before Election Day. Charles has a new post over at ElectionUpdates that has some interesting – and encouraging – news about the progress being made on reducing waits at the polls:
Last Thursday I helped kick off Pew’s Voting in America event by reviewing the preliminary findings from the 2016 Survey of the Performance of American Elections. (My presentation begins at 1:06:55 in the YouTube video.) While there is a little more work to be done in wrapping up all the data gathering, we have enough responses in to begin painting a systematic view of the election process in 2016 from the perspective of the voters.
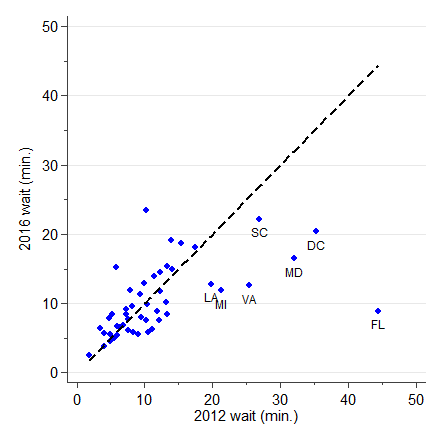
One important piece of news from that presentation is that average wait times to vote were down in 2016, compared to 2012, particularly in the states that had the longest waits in 2012. The [above] graph shows the overall perspective. Here, I have plotted average 2016 wait times against average 2012 wait times. States below the diagonal line had shorter lines in 2016. I’ve labeled the states that had the biggest improvements. Note particularly the drop in Florida times, from an average of 45 minutes to less than 10 minutes.
This is significant news, and a tribute to all the work that went into making the 2016 election run smoothly, despite public comments intended to cast doubt on the quality of American election administration. The news is a feather in the cap of the bipartisan Presidential Commission on Election Administration, whose creation was spurred on by images of long lines in the 2012 election, both on Election Day itself and in early voting.
Despite this good news, there is still work to be done to achieve the PCEA benchmark that no voter wait longer than 30 minutes in line. First, even with the significant reduction in wait times among the states with the longest times in 2012, a significant fraction of voters still waited longer than 30 minutes in many states. (More than 10% of voters waited longer than 30 minutes in roughly half the states.) Second, while the racial disparities reported in 2012 were diminished in 2016, they weren’t wiped out entirely; the disparity in wait times between whites and blacks in early voting narrowed only slightly.
Nonetheless, this is at least preliminary evidence that when the elections community puts its mind to it, real improvements can be made in the experiences of voters.
I’m with Charles; this is good news for the field and an indication that the focus on waiting times (and the issues that increase them) has been time well-spent. Charles is also right that the problem is far from solved, but it’s good to see a positive trend line.
Thanks, as always, to Charles for both this post but especially the SPAE data … if history is any guide, he will many more fascinatingg things to say about the data in the weeks and months to come.
Stay tuned!